A short graph analysis application using PySpark and GraphFrames library!

I would like to show some tips and practical ways to make a data analysis using Spark. In particular, the GraphFrames library will be used. There are plenty of beautiful manual/References/articles for knowing the WHY Spark is one of the best solution for working with BigData, so i prefer to focus on a small percentage of the HOW. In particular, the GraphFrames library will be used. It will be assumed that the readers have a knowledge of what a graph is, which are the main graph algorithms and so on.
Spark GraphX and GraphFrames:
The Spark GraphX is a library RDD-based for performing graph processing, it is part of Spark, like Spark SQL, MLib or Spark streaming. However, it is not easy to use or optimise, because it works directly on RDDs, that are not very easy to manage as DataFrames are. GraphFrames comes to fill this gap. It is a DataFrame-based library for performing graph processing. At this moment It is a Spark external package built on top of GraphX, may be merged with core of Spark in the future. So, we can say that: GraphX is to RDDs as GraphFrames are to DataFrames.

How does it work?
In my opinion It is very intuitive and straightforward to manage. So, I decided to show a short application of It directly to the readers, and I’m sure that it will be easy to follow the steps flow. Three datasets are used. One contains information about airports like the IATA code, or the ICAO code. Another one contains information about airline and the last one contains information about routers a specific airline does.

A first query may be asking which are the countries in the world with more than 100 airports?

Here, first of all airportDF’s rows are grouped by country, because we want to know how many airports they have. Here, the collect_list built-in function helps us. Indeed, it allows to make a list containing all values of a specific column (name for us). Now, it is easy to see the size of that list using the size built-in function and filtering out all countries with less than 100 airports. Finally, the dataframe is sorted with respect to the airport_ls size, in order to obtain a descending ordered list. The United States is on top followed by China and Australia, in according with our dataset. Good! It may be interesting asking more or less the same stuff for airlines. Which are the TOP 10 airlines by total number of flights?
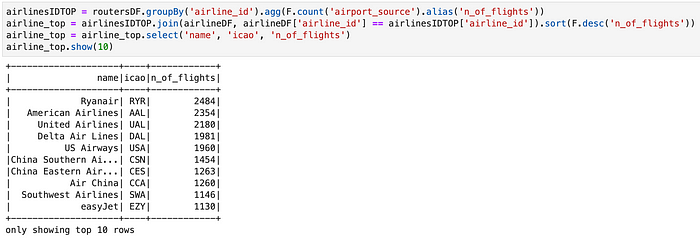
Here we are. Ryanair low-cost company is on the top of our ranking, in according with our dataset. Note the powerful join tranformation that allows to join two different dataFrame in according with a certain condition. In our example, the airlinesIDTOP’s rows are joined with the airlineDF’s rows if and only if the airline_id values of the first one DataFrame are equal to the airline_id values of the second ones. In this way we are sure to join the correct airline_id with the correct n_of_flights. PySpark is cool, isn't?
Very well, now we focus on the main subject of the story: GraphFrames. Our datasets are particular suitable for explaining Graph concepts: a natural choice for vertices is to use airports, while an edge between two vertex will be a flight.

First of all we import all methods from the graphframes library. In GraphFrames building a Graph is easy. It is enough to give to the GraphFrame method the vertex and the edges. That's it. One important stuff is that the vertex DataFrame must have a column named id, while, the edges DataFrame must have at least two columns named src (source) and dst (destination). They will be used for building the Graph. Note that we are bulding an undirect graph and that the returned value of GraphFrames is not a DataFrame but a GraphFrame.
The first algorithm we want to use is about the in and out degree one.

Let’s pass to a very nice application of SparkFrames: the motif finding functionality. The motif finding functionality allows to find and analyse patters in the Graph. Let’s suppose we are interested in knowing How many airports can be reached from Turin taking exactly one flight, and What about taking just 2 flights? or 3 flights?

The language requires to specify vertices in round brackets and edges in square brackets. the motifs_1 DataFrame is obtained by using the method find and the sintax “(a)-[e]->(b)” meaning we want all relationships between the generic node a and the generic node b. In other words, we are selecting all nodes with at least one edge. Then, we are selecting all nodes with at least one edge to other nodes with at least another edge excluded the edge between a and b ([e2] != [e]), and so on. Finally, we filter by selecting only the nodes with an id equal to 1526 (Turin).
Another useful algorithm is the shortest path ones. Suppose we are interested in knowing which are the top 10 airports that are farther from Turin, in terms of number of hops. Here we are! Peawanuck Airport has a number of 8 hops from Turin, meaning we have to take at least 8 flights from Turin for reaching Peawanuck Airport.

Finally, we show how to visualize a graph. Of course, visualise a graph is very useful for acquiring in a flash global information. Unfortunately, for the moment there are not built-in methods for plotting a Graph directly using GraphFrame, but Python has a lot of wonderful libraries that help for that. We selected the Graphviz library. For example, we should plot the Sub-Graph representing only the flights that are performed either by AirDolomiti (icao = DLA) or by Sky Airline (icao = SKU)


This was just a very short introduction to the subject, GraphFrames and the Spark Universe in general, is very vaste, as well as very useful in the BigData domain. I hope it was helpful for you! Let’s keep in touch!